
 Sign in
 Ozeki Diagnostics Quick Start Guide
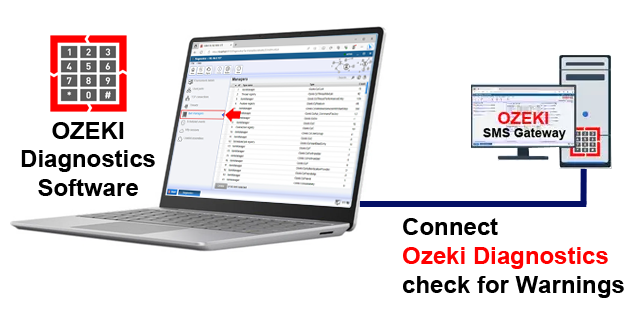
In this article, you can read about how Ozeki Diagnostics offers a comprehensive solution to monitor and optimize the system resources of the Ozeki SMS Gateway. It enables you to detect bottlenecks, identify potential performance issues, and take proactive measures to ensure the smooth operation of the Ozeki SMS system.
What is Ozeki Diagnostics?
With Ozeki Diagnostics, you can delve deep into your system's infrastructure and gain valuable insights into the utilization of CPU, memory, disk space, and network resources. By analyzing the real-time data and generating detailed reports, you can identify areas of concern and optimize resource allocation accordingly.
Furthermore, Ozeki Diagnostics offers intuitive visualizations and alerts to keep you informed about critical resource levels. It empowers you to take timely action, prevent system slowdowns or failures, and ultimately enhance the overall performance and reliability of your system.
Ozeki Diagnostics' functions:
- Real-time system health monitoring of system resources
- Identify bottlenecks, and optimize performance
- Intuitive visual resource representations
- Comprehensive reports on resource usage
- Proactive alerts for critical levels
- Historical data tracking for analysis
- Suggests optimizations based on usage
- Seamless integration with SMS Gateway
- Fine-tune parameters for efficiency
- Assist in capacity planning
How to enable Ozeki Diagnostics (simple instructions)
To enable Ozeki Diagnostics
- Access your Ozeki SMS Gateway account
- Open the Ozeki Diagnostics app
- Enable diagnostics in Ozeki SMS Gateway
- Restart Ozeki service
- Log in to the Ozeki SMS Gateway again
- Check Ozeki Diagnostics tools and functionalities
- Get access to the hardware details
- View message destination details
- Deactivate Ozeki Diagnostics
- Restart Ozeki service again
- Log in to the Ozeki SMS Gateway again
Get to know about Ozeki Diagnostics (video tutorial)
In this brief video, you can learn the basic steps of Ozeki Diagnostics, which is a powerful tool designed to optimize and monitor system resources for the Ozeki SMS Gateway. By following these steps, you can enhance the performance, reliability, and overall operation of your Ozeki SMS system.
To begin the process, log in to your Ozeki SMS Gateway account, or if you do not have one yet, create one by downloading the Ozeki SMS Gateway software from the ozeki-sms-gateway.com website. Navigate to the Gateway's Start menu and choosing the "Administrative Tools" option from the "Programs" menu. There, select the "Diagnostics" app.

In the Ozeki Diagnostics app you can find information about the CPU's environment, used TCP ports, scheduled events, HTTP sessions, and loaded assemblies. Click on the "Enable" button to run Diagnostics. Restart the Ozeki service, by pressing the "Ok" button.

To initiate a restart of the Ozeki SMS Gateway, launch the Services application on your computer and locate the Ozeki service. Click on the "Restart the service" link to start the process. This action will prompt the Ozeki SMS Gateway service to stop and then start again, ensuring a fresh operational state and applying any necessary updates or changes.

Login to your Ozeki SMS Gateway account again, and load the "Diagnostics" app, by navigating to the Gateway's Start menu and choosing the "Administrative Tools" option from the "Programs" menu to see the CPU Environment details.

Open "Used Ports" to see the used TCP ports. This information can be valuable for monitoring network activity and identifying any potential conflicts or issues related to port availability. By reviewing this data, you can acquire insights into the specific ports that are engaged in ongoing.

You can explore detailed TCP information in the TCP connections section. This section offers a thorough overview of data related to running TCP connections, allowing you to dive into the specifics of each connection's features and qualities. As it enables you to keep track of the most minute details of your TCP transmission, this function is important for thorough network research and troubleshooting.

You have access to a thorough view of Thread information in the Threads section. You can analyze the unique qualities and traits of each thread thanks to the insights into the complexity of particular threads that are given to you in this section. To effectively manage and optimize your processes, you must use this feature to gain a deeper understanding of thread behavior and performance.

The Item Managers section is a dedicated area where you can manage and oversee various items. You can manage, organize, and change things in this section according to your preferences. Adding new things, changing old ones, classifying objects, establishing characteristics, and other actions may well be involved in this.

The Scheduled Events section offers a platform for managing and maintaining events that have been planned to take place at certain intervals. According to your needs, you can add, modify, or delete scheduled events in this section. These events might include system tasks, automated processes, notifications, backups, and more.

A user's web browser's connection or interaction with a web server while using a web application is referred to as an HTTP session. The HTTP Sessions section typically provides tools and insights for understanding, controlling, and troubleshooting these sessions.

Dynamic link libraries (DLLs) and other assemblies that have been loaded into memory during runtime are often described in the "Loaded Assemblies" part of a software program, development environment, or system. These assemblies include resources and executable code needed to create and operate programs.

Select the "Hardware" icon from the toolbar, to get access to the hardware details. This action will provide you with information about the components and specifications of the hardware within the system.

Click on the Message engine icon to see message destination details. You can explore the destinations, addresses, and related information associated with the messages being processed by the message engine.

Choose the "Disable" icon to deactivate diagnostics features. Click on the "Ok" button to confirm, then restart the Ozeki service.

Launch the Services application on your computer and locate the Ozeki service. Click on the "Restart the service" link to start the process. This action will prompt the Ozeki SMS Gateway service to stop and then start again, ensuring a fresh operational state and applying any necessary updates or changes. Login to your Ozeki SMS Gateway account again and load the "Diagnostics" app by navigating to the Gateway's Start menu and choose the "Administrative Tools" option from the "Programs" menu to see the CPU Environment details.

FAQs
What is hardware diagnostics?
The process of detecting, analyzing, and resolving problems in computer hardware components is known as hardware diagnostics. Using specialized tests and software to find faults or malfunctions in parts such as the CPU, RAM, hard drive, graphics card, and more involves this. The goal is to determine hardware-related issues so they can be effectively fixed or replaced and the normal operation of the computer system is guaranteed.
How do I run a hardware diagnostic?
Many computer manufacturers offer built-in diagnostic tools accessible during boot-up by pressing specific keys (like F12 or ESC). Alternatively, you can use third-party software tools designed for hardware testing, such as Ozeki Diagnostics.
How do I check my hardware health?
You can check your hardware's health by using specialized software tools designed for monitoring and diagnosing hardware components. Download and install reputable programs such as Ozeki Diagnostics, which provide real-time data on overall system performance.
Summary
In this Ozeki Diagnostics Quick Start Guide, we provide an overview of the benefits, functionalities, and setup process of Ozeki Diagnostics. You can see that Ozeki Diagnostics is a comprehensive tool designed to monitor and optimize system resources for the Ozeki SMS Gateway. By following the given steps, you can enhance the performance, reliability, and overall operation of your Ozeki SMS system.